

TL;DR:
- Effective signage investment relies on baseline data, multi-metric measurement, and strategic placement. Proper planning, pilot testing, and operational cost control are essential for maximizing return on investment. Measuring signage as a performance channel, not just an expense, leads to more accurate assessments and better business outcomes.
Signage ROI is defined as the measurable financial return a business generates from its investment in visual communication assets, including direct sales lift, operational savings, and brand value gains. Knowing how to maximize signage roi separates businesses that treat signs as a one-time expense from those that treat them as a performance channel. A well-executed digital signage deployment typically yields a 20–40% ROI in the first year, growing to 60–150% by the third year. That trajectory only happens when you measure correctly, plan strategically, and optimize continuously.
How to maximize signage ROI: what metrics matter first
Before you can improve signage return, you need a clean baseline. Baseline metrics like sales per promoted item and foot traffic counts must be recorded 60–90 days before installation for valid ROI analysis. Skipping this step means your post-campaign numbers have nothing to compare against, and any lift you report is an estimate, not a fact.

The right KPIs to track
The most useful signage KPIs fall into four categories:
- Direct revenue: Sales per promoted product, average transaction value, and basket size before and after signage deployment
- Operational savings: Print cost reduction, staff time saved on manual updates, and reduced customer service inquiries from clear directional signage
- Foot traffic: Customer counts measured by in-store sensors or POS transaction volume at specific times
- Brand and experience value: Repeat visit rates, customer satisfaction scores, and social media mentions tied to a campaign
ROI vs. Return on Objectives (ROO)
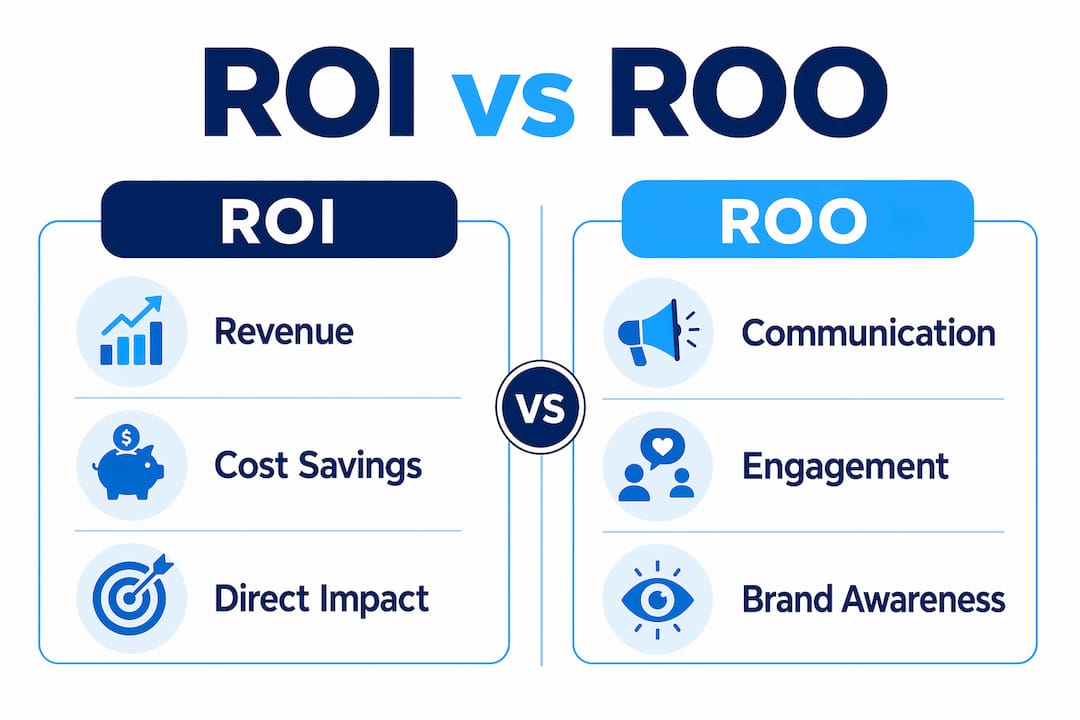
Businesses must distinguish between ROI and Return on Objectives, or ROO. ROI measures direct revenue or cost savings. ROO tracks communication outcomes like brand consistency, safety messaging, and employee awareness. A retail chain running a promotional banner campaign should measure ROI. A hospital using wayfinding signs should measure ROO. Using the wrong framework produces misleading conclusions.
| Metric type | Best use case | Example |
|---|---|---|
| ROI | Revenue-driving signage | Promotional banners, product displays |
| ROO | Communication or brand signage | Wayfinding, safety signs, brand walls |
| Blended | Multi-purpose campaigns | Retail environments with mixed goals |
Pro Tip: Set up your POS system to tag promoted SKUs before launch. That single step lets you pull clean sales lift data the moment your signage goes live.
How should you plan and design signage for maximum impact?
Strategic planning is where most signage investment tips pay off the fastest. A sign in the wrong location, with a cluttered message, delivers near-zero return regardless of print quality. Effective signage placement significantly increases visibility and customer engagement, which translates directly into stronger campaign performance.
Follow this planning sequence to increase signage effectiveness before you spend a dollar on production:
- Define the objective first. Decide whether the sign drives a purchase, directs foot traffic, or builds brand recognition. Each goal requires a different message structure and placement logic.
- Map your audience’s physical path. Identify where your customers walk, pause, and make decisions. High-dwell zones like checkout lines, waiting areas, and building entrances deliver the highest engagement per impression.
- Simplify the message. A single headline, one supporting line, and one clear call to action outperform busy designs every time. If a passerby cannot read your sign in three seconds, the message is too complex.
- Combine digital and static formats. Digital displays allow real-time updates for promotions and emergencies. Static signs anchor brand identity and directional cues. Using both formats together extends your reach without doubling your budget.
- Run A/B tests on content and placement. Swap headlines, colors, or locations between two comparable store zones and measure sales lift for each. This turns your signage network into a testable media channel rather than a fixed cost.
- Balance design costs against expected returns. A $500 banner driving $5,000 in incremental monthly sales has a clear payback. A $10,000 custom installation with no measurement plan is a gamble.
Pro Tip: When designing for outdoor placement, test your sign’s legibility at the actual viewing distance before production. Print a scaled mockup and walk the approach path. What looks clear on screen often fails at 30 feet.
Learning to plan a signage campaign with this level of rigor is what separates businesses that see consistent returns from those that replace signs every year without knowing why.
How do you execute and measure signage campaigns to improve ROI continuously?
Execution without measurement is just decoration. Signage performance strategies that produce lasting results rely on three disciplines: pilot testing, multi-metric dashboards, and operational cost control.
Start with a pilot, then scale
Launch your signage campaign in one location or one zone before rolling it out across your full network. Collect four to six weeks of data. Compare POS sales for promoted items against your pre-campaign baseline. If the lift is statistically meaningful, scale. If it is not, adjust the message or placement before committing to a larger investment.
Build a multi-metric ROI dashboard
Avoiding reliance on single metrics like QR code scans and instead integrating multiple data points creates a dashboard that drives better decisions. Your dashboard should pull from at least three sources:
- POS transaction data tied to promoted products
- Foot-traffic sensor counts at sign locations
- Social listening data for campaign-related mentions
Unified ROI dashboards improve signage investment outcomes by connecting these streams into one view. A spike in QR scans means nothing if POS data shows no corresponding sales increase. Conversely, a POS lift with no QR activity confirms that the physical sign, not the digital call to action, is driving the result.
Control operational labor costs
Operational labor costs related to content creation, scheduling, and maintenance often exceed hardware and software costs in total cost of ownership for multi-location signage networks. This is the most overlooked line item in signage budgets. Assign clear ownership for content updates, set a publishing schedule, and use a content management system that allows batch updates across locations. Unmanaged labor costs extend your payback period and suppress your net ROI.
| Cost category | Common mistake | Fix |
|---|---|---|
| Content production | Redesigning from scratch each campaign | Build reusable templates |
| Scheduling | Manual updates at each location | Use centralized CMS software |
| Maintenance | Reactive repairs only | Schedule quarterly inspections |
| Measurement | Checking results once post-campaign | Set monthly review cadence |
What mistakes kill signage ROI and how do you fix them?
Even well-funded signage programs fail when they repeat the same operational errors. Recognizing these pitfalls early protects your budget and your results.
- Relying on one data point. QR code scans, foot traffic alone, or social impressions each tell a partial story. Combining foot traffic, POS spikes, and social listening gives you the full picture. Single-metric reporting consistently overstates or understates actual performance.
- Ignoring content update speed. Digital signage updates take minutes versus days for print, and that speed holds measurable dollar value during time-sensitive campaigns. Businesses that cannot update messages quickly miss flash sales, weather-triggered promotions, and emergency communications.
- Skipping the baseline period. Installing signage and then trying to reconstruct pre-campaign data from memory produces inflated results. The 60–90 day pre-installation data capture is not optional. It is the control group for your entire analysis.
- Misaligning signage goals with business goals. A sign promoting a low-margin product in a high-traffic zone wastes prime real estate. Every sign placement should connect to a specific revenue or efficiency objective.
- Neglecting legal and visibility compliance. Zoning restrictions, ADA requirements, and local ordinance limits on sign size or lighting can force costly redesigns after installation. Verify compliance before production, not after. Non-compliant signs get removed, and removal costs eliminate any ROI you projected.
- Using poorly designed calls to action. Vague CTAs like “Learn More” or QR codes that do not work on mobile reduce engagement and make attribution impossible. Every sign needs a specific, testable action tied to a measurable outcome.
Key Takeaways
Maximizing signage ROI requires baseline data, multi-metric measurement, strategic placement, and disciplined operational cost control working together as a system.
| Point | Details |
|---|---|
| Capture baseline data first | Record sales and foot traffic 60–90 days before installation to enable valid ROI comparison. |
| Distinguish ROI from ROO | Use ROI for revenue-driving signs and ROO for communication or brand-focused signage goals. |
| Build a multi-metric dashboard | Combine POS data, foot-traffic counts, and social listening to avoid single-metric blind spots. |
| Control operational labor costs | Content production and scheduling often exceed hardware costs; use templates and a centralized CMS. |
| Test before scaling | Pilot in one zone, measure lift against baseline, then expand only what the data confirms works. |
Why I think most businesses measure signage wrong
Most businesses I have worked with treat signage measurement as an afterthought. They install the sign, run the campaign, and then ask whether it worked. By that point, there is no baseline to compare against, and the answer is always a guess.
The shift that changes everything is treating signage as a capital asset with a defined payback period, not a marketing line item you write off in the first quarter. When you treat signage as a testable media channel, you start asking different questions before installation: What is the expected sales lift? What is the break-even timeline? What does the content update schedule look like for the next 12 months?
The businesses that consistently report strong signage returns are not spending more. They are measuring more. They run pilots. They build dashboards. They track operational labor as a real cost, not an invisible overhead. And they update content frequently enough to keep the channel performing.
One more thing worth saying directly: the ROI vs. ROO distinction is not academic. I have seen healthcare clients chase revenue metrics on wayfinding signs and declare their signage program a failure because sales did not move. The sign was doing its job perfectly. They were measuring the wrong thing. Match your framework to your objective before you spend anything.
— Yossi
How Customsignstoday helps you get more from every sign
Putting these strategies into practice starts with signage built for performance, not just appearance. Customsignstoday produces custom signs designed for visibility, durability, and message flexibility across every format your business needs.
Whether you need face change signs that let you swap promotional messages without replacing the full structure, site signs that anchor your brand at high-traffic locations, or vehicle lettering that turns your fleet into a moving campaign, Customsignstoday delivers production quality that supports your measurement goals. Every product is built to perform in real-world conditions, from Florida heat to high-visibility outdoor placements. Request a free quote and start building signage that earns its place in your budget.
FAQ
What is signage ROI and how is it calculated?
Signage ROI is the net financial return from a signage investment divided by its total cost, expressed as a percentage. Total cost includes hardware, production, content creation, and ongoing operational labor.
How long does it take to see a return on signage investment?
A well-executed deployment typically produces a 20–40% ROI in the first year and 60–150% by year three. Returns accelerate when baseline data is captured and content is updated regularly.
What is the difference between ROI and ROO in signage?
ROI measures direct revenue or cost savings from signage. ROO, Return on Objectives, tracks communication outcomes like brand consistency or safety compliance, and is better suited for non-revenue signage goals.
How many data sources should a signage ROI dashboard include?
A reliable dashboard pulls from at least three sources: POS transaction data, foot-traffic sensor counts, and social listening or engagement metrics. Single-source measurement consistently produces inaccurate results.
Why does content update speed affect signage ROI?
Faster updates allow real-time promotions and emergency messaging that print cannot match. Digital signage updates in minutes versus days for print, and that speed directly translates to revenue during time-sensitive campaigns.